
|
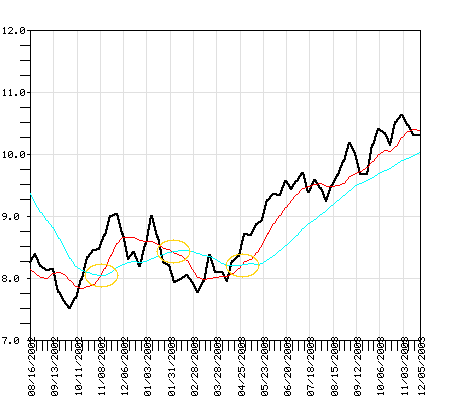
Shown in black is the plot of the closing price of the ISWCX Mutual Fund over the last year. The colored lines indicate two moving averages. Where these lines cross each other indicates a signal to buy or sell. If the trend is down, the red line will cross and be below the green line indicating a sell signal. The same is true when the trend changes to the up side. The red line will cross the green line on the up side and indicate a buy signal.
The current graph indicates 3 crossover events.
Replot this fund with your own parameters.
See considerations before making any investment decisions, and also check the disclaimer.
For more information contact Herb Seidel
Back to Index.
© Copyright Chris Seidel 1996 All Rights Reserved